Grafana AMI User Guide

Monitoring shouldn’t take hours to set up. At Prezelfy, we believe observability should be fast, secure, and reliable — right out of the box. That’s why we built our Grafana Host AMI: a pre-configured, hardened Amazon Machine Image that lets you launch Grafana OSS in just a few clicks.
Whether you're a DevOps engineer spinning up dashboards for EC2 metrics or a startup founder wanting real-time visibility into your systems, this AMI helps you get started without writing a single line of setup code.
What Do We Offer with Our Grafana Host AMI?
This isn’t just a vanilla Grafana install. Our AMI is designed to save you time, boost your security posture, and reduce the friction of standing up your own monitoring stack. Here’s what’s included:
- Grafana OSS
- Amazon Linux 2023, hardened using CIS Benchmarks
- Weekly rebuilt AMIs to ensure up-to-date security patches
- Base plugin set for popular datasources like Prometheus and CloudWatch
- Port 3000 pre-opened in the firewall for Grafana Web UI access
- Grafana admin password managed securely via SSM Parameter Store
- SSH access locked down by default
In short: launch, log in, and monitor.
Architectural Design
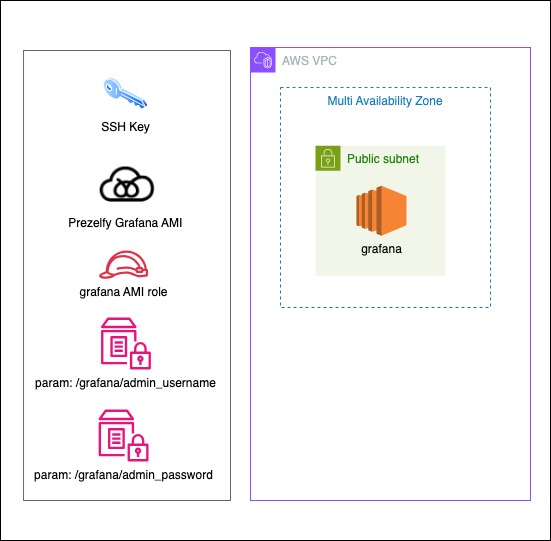
The Prezelfy Grafana Host AMI is designed around three key principles: security, simplicity, and scalability. We wanted a setup that works just as well on a t2.medium (also base it on number of Dashboards and Alarms you have) as it does in an enterprise-grade observability pipeline — without the maintenance burden. Whether you’re connecting to Prometheus, CloudWatch, or Loki, the architecture ensures that Grafana is lightweight, isolated, and ready to integrate with your existing AWS infrastructure. If you’re visual — here’s a look at how it all fits together:
The AMI runs Grafana as a systemd service on Amazon Linux 2023. It is optimized to run on small instance types (e.g., t3.micro) but scales cleanly on larger ones.
- Security First: SSH is disabled or locked to your keypair. Only port 3000 is open.
- Stateless Setup: The AMI does not store metrics itself — it connects to external datasources (CloudWatch, Prometheus, etc.)
- User Management: Admin credentials are stored securely in SSM Parameter Store, and the user data script sets the password on first boot.
- Up-to-Date: Each week, we publish a fresh AMI with all system and Grafana updates included. No patching needed on your end.
Installation Guide: How to Launch
- Generate key pair and save private key on secure placeFollow the steps: Create and Manage Key Pairs - AWS EC2 Documentation
- Create parameters in SSM Parameter store: Follow the steps: Create and Manage SSM Parameters (SecureString) - AWS SSM Documentation2 required parameters:
- /grafana/admin_username
- /grafana/admin_password - Create AMI Role: Follow the steps: Create and Manage AMI Instance profile - AWS IAM Documentation Minimum permissions for role:
- ssm:GetParameter
- ssm:GetParameters
- secretsmanager:GetSecretValue - Subscribe to the AMI on AWS Marketplace
- Launch a new EC2 instance using the AMI
- Attach IAM role instance profile created in previous step
- Choose a security group that allows inbound access on port 3000 (HTTP)
- Once launched, navigate to:
http://:3000 - Log in using:
- Username: retrieved from SSM Parameter Store (/grafana/admin_username)
- Password: retrieved from SSM Parameter Store (/grafana/admin_password)
- Secure Remote SSH Access
- username: ec2-user
password: use generated SSH-key - Example:
ssh -i grafana.pem ec2-user@ip
- username: ec2-user
Done. No installation. No dependency resolution. Just dashboards.
How to Use Grafana?
Once you're logged in, Grafana works just like any other Grafana OSS deployment. You can:
- Add data sources like Prometheus, CloudWatch, Loki, InfluxDB
- Import dashboards from Grafana’s official library
- Create alerts and visualizations in minutes
- Invite team members and set roles
Your data stays in your environment — our AMI just gives you the platform to view and act on it.
Troubleshooting: Grafana Host Not Working?
Here are some common issues and how to solve them:
- Can't reach the web UI?
Make sure port 3000 is open in your EC2 security group and check that your instance has a public IP. - Forgot your admin password?
If you're using SSM Parameter Store, go to the AWS Console → Systems Manager → Parameter Store, and retrieve the value.
Alternatively, relaunch the instance with a new user data script to reset the password. - Grafana service isn’t running?
SSH into the instance (if enabled) and run:sudo systemctl status grafana-server
Or use EC2 instance logs to check boot errors. - SSL not working?
Double-check your domain’s DNS and Let’s Encrypt preconditions. Our docs cover optional SSL configuration in detail.
If you're still stuck, just reach out to support@prezelfy.com — we’re happy to help.
Ready to Launch?
You can get started on AWS Marketplace today. Our Grafana Host AMI is built for speed, security, and simplicity — so you can stop worrying about setup and start focusing on what your metrics are telling you.