Prometheus AMI User Guide

Observability shouldn’t require hours of manual setup or navigating confusing config files. At Prezelfy, we believe monitoring should be fast, secure, and reliable — right out of the box. That’s why we built our Prometheus Host AMI: a pre-configured, hardened Amazon Machine Image that lets you launch Prometheus OSS in just a few clicks.
Whether you're a DevOps engineer collecting EC2 metrics or a startup founder who needs real-time visibility into your services, this AMI helps you get started without writing a single line of setup code.
What Do We Offer with Our Prometheus Host AMI?
This isn’t just a vanilla Prometheus install. Our AMI is designed to save you time, boost your security posture, and reduce the friction of standing up your own monitoring backend. Here’s what’s included:
- Prometheus OSS 2.51.0, pre-installed and configured
- Amazon Linux 2023, hardened using CIS Benchmarks
- Weekly rebuilt AMIs to ensure up-to-date security patches
- Preconfigured Prometheus scrape config for
localhost:9090 - Prometheus runs as a managed systemd service
- Port 9090 pre-opened in the firewall for Prometheus Web UI access
- SSH access locked down and only enabled if launched with your own key pair
- System directories and permissions configured for secure operation
In short: launch, monitor, and alert — without the operational overhead.
Architectural Design
The Prezelfy Prometheus Host AMI is designed around three key principles: security, simplicity, and scalability. It works just as well on a t3.micro for testing as it does as part of a larger observability platform — without the need for manual patching or complex configuration.
Whether you’re scraping metrics from EC2, containers, or your own apps, the architecture ensures that Prometheus is lightweight, isolated, and ready to integrate with your AWS infrastructure.
Key design highlights:
- Stateless Setup: Prometheus stores metrics locally but does not persist configuration from external sources. The default
prometheus.ymlis editable via SSH. - Security First: SSH is disabled or restricted by keypair. Only port 9090 is open by default.
- Systemd-Based: Prometheus runs as a service, ensuring automatic startup and restart on failure.
- Firewall-Managed Access:
firewalldis enabled and pre-configured, with strict control over exposed ports. - Up-to-Date: Each week, we publish a fresh AMI with all system and Prometheus updates included. No patching needed on your end.
Whether you're monitoring a single EC2 instance or integrating with Grafana and Alertmanager, this AMI gives you a lightweight, reliable foundation to build on.
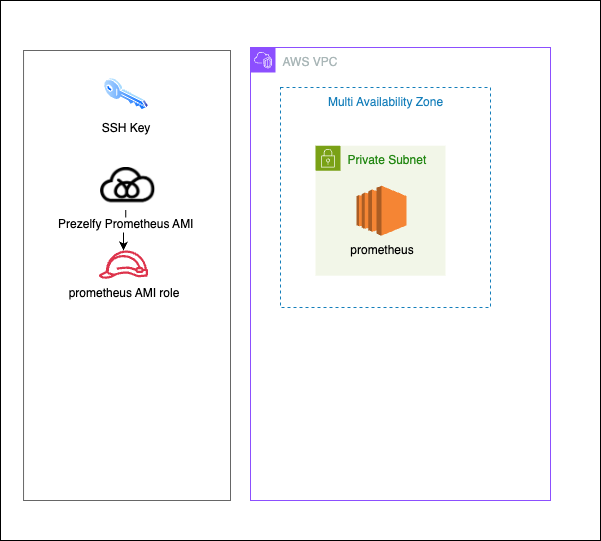
If you’re visual — here’s how it all fits together:
Installation Guide: How to Launch
You don’t need to install anything or resolve dependencies — just launch and monitor.
Steps:
- Generate a Key Pair
Follow the AWS EC2 docs to create a key pair and securely store the private key. - Launch the AMI
- Subscribe to the AMI on AWS Marketplace
- Create a new EC2 instance using the AMI
- Attach your SSH key pair (optional, for admin access)
- Choose a security group that allows access to port 9090 only from trusted sources, such as:
- Your office IP (e.g.,
203.0.113.5/32) - Your VPN network (e.g.,
198.51.100.0/24) - A private CIDR inside your VPC (e.g.,
10.0.0.0/16)
- Your office IP (e.g.,
- Avoid exposing port 9090 to
0.0.0.0/0unless you secure it with a reverse proxy
- Access Prometheus Web UI
http://<your-ec2-instance-public-ip>:9090/graph - Optional SSH Access
ssh -i your-key.pem ec2-user@<your-ec2-instance-public-ip>
How to Use Prometheus?
Once you're connected, Prometheus works just like any other OSS deployment. You can::
- Query and explore metrics with PromQL
- View target health and scrape statuses
- Manually edit
/etc/prometheus/prometheus.ymlto add or change targets - Restart the service with
sudo systemctl restart prometheus - Integrate with Alertmanager or Grafana
- Add rules to
/etc/prometheus/rules.yml(manual step)
Your data stays in your environment — our AMI just gives you the platform to collect and act on it.
Troubleshooting: Prometheus Host Not Working?
Can’t reach the Web UI?
- Make sure port 9090 is open in your EC2 security group for your current IP address or network
- Use an SSH tunnel if you want to keep port 9090 entirely private
Prometheus service isn’t running?
- SSH into the instance and run:
sudo systemctl status prometheus
Need to update your targets?
- SSH into the instance
- Edit
/etc/prometheus/prometheus.yml - Restart the service:
sudo systemctl restart prometheus
Still stuck?
Reach out to support@prezelfy.com — we’re happy to help.
Ready to Launch?
You can get started on AWS Marketplace today. The Prezelfy Prometheus Host AMI is built for speed, security, and simplicity — so you can stop worrying about setup and start focusing on what your metrics are telling you.